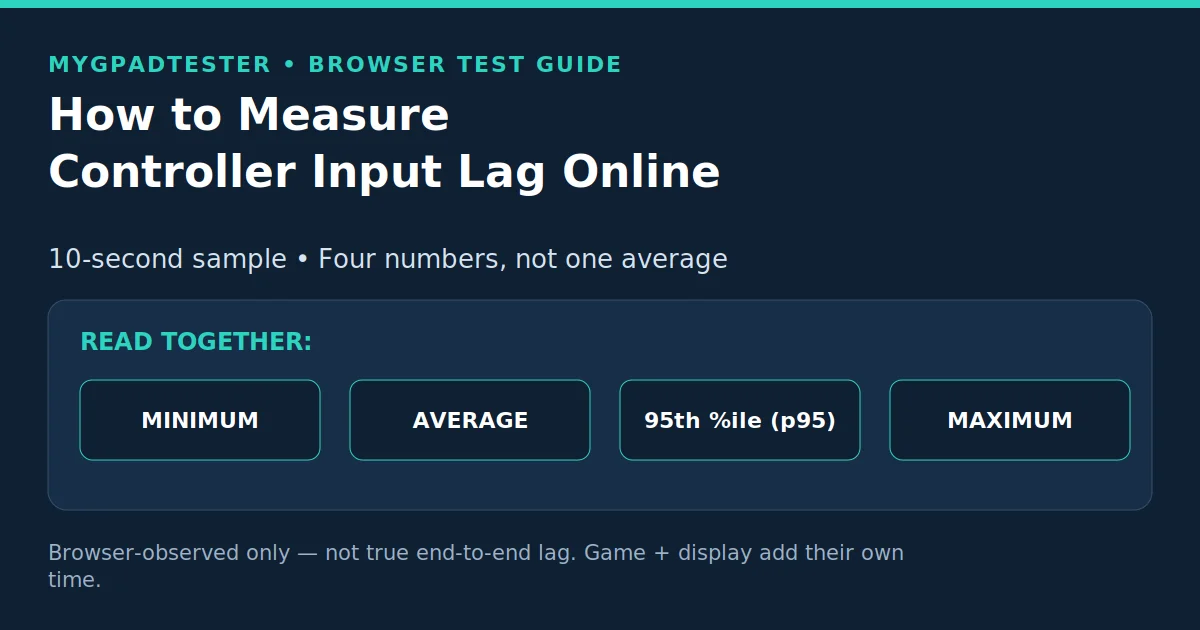
How to Measure Controller Input Lag Online
Subtitle: Measure your controller’s lag contribution in the browser, in a 10-second sample, and read four numbers, not one average.
Last updated 14 November 2026 | Category: Controller Testing Tools | Reading time: about 9 minutes | Tested with Chrome/Edge, Gamepad API
Supported controllers strip (plain text): PS5 DualSense · Xbox Series · Switch Pro · PC · Generic pads: browser test, no download.
You press a button and the action on screen feels late. Here is how to measure which link is slow.
Quick Answer
Open the input lag test, connect wired first, then move a stick or press a button continuously for 10 seconds. Read minimum, average, 95th percentile and maximum browser intervals together. A browser test measures the controller’s contribution, not true end-to-end lag. The game and display add their own time on top.
Tool CTA
Use our free input lag test: Test your input lag free
No download. No account. Data stays in your browser.
How to read the sample: the four numbers that matter
A clean browser sample gives you four numbers, and you need all four before you judge anything. Most lag tests fail the reader the same way: they show one average and stop. One average hides what you actually feel in a game. It hides the occasional spike, the dropped gap, and the run that is fine for nine seconds and terrible for one.
Polling interval is one slice of the chain (the report interval between controller reports). It is covered in the polling guide linked below. This post is not that guide. Its job is narrower. Run one clean 10-second sample. Read the four numbers correctly. Compare wired against wireless with the same motion. Then you can say whether the controller link itself is slow, spiky, or fine.
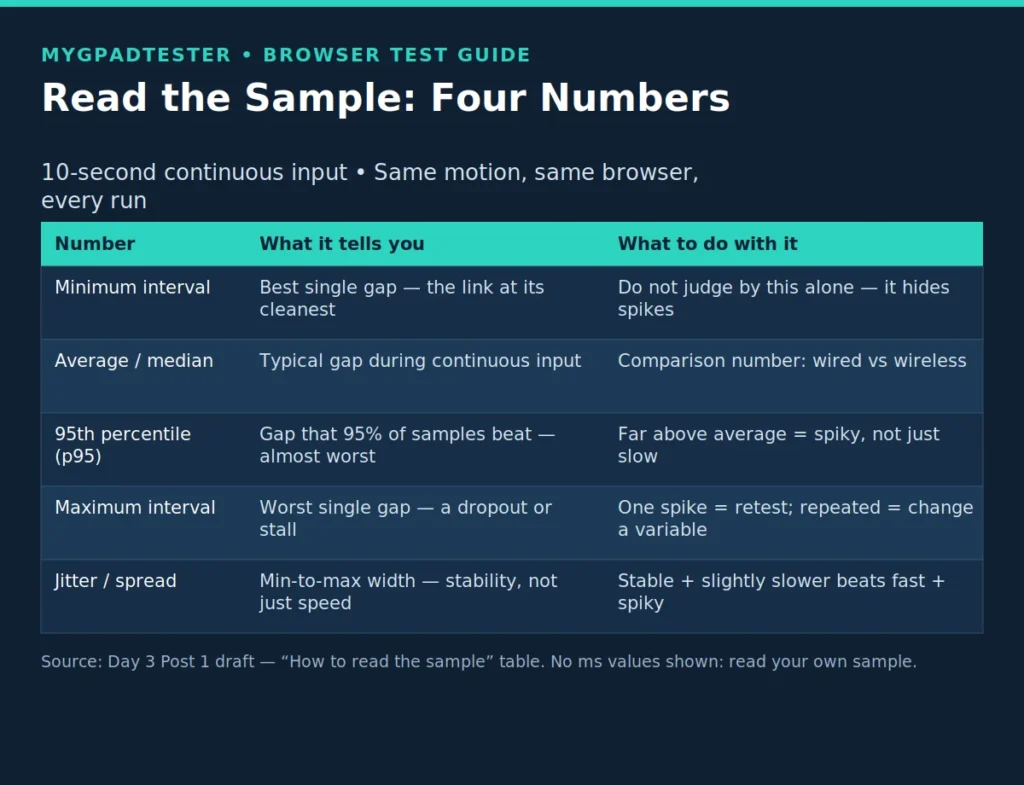
| Number | What it tells you | What to do with it |
| Minimum interval | Best single gap in the sample; shows the link at its cleanest | Do not judge by this alone: it hides spikes |
| Average / median interval | Typical gap during continuous input; the comparison number | Compare wired vs wireless, same browser, same motion |
| 95th percentile (p95) | Gap that 95% of samples beat; the “almost worst” case | If p95 is far above average, the link is spiky, not just slow |
| Maximum interval | Worst single gap; a dropout or stall | One max spike = retest; repeated max spikes = change a variable |
| Jitter / spread | How wide min-to-max is; stability, not just speed | Stable and a few ms slower feels better than fast and spiky |
Before you start: the setup that changes the number
A lag sample is only as clean as its setup. Two runs with different setups are not comparable. That is how readers reach false conclusions. For example, a claim that Bluetooth is much worse, from one messy wireless run against one clean wired run.
Use desktop Chrome or Edge first. They are the reference browsers for this method, because Gamepad API timestamps are most consistently available there. Firefox is usable for basic testing. Safari and mobile browsers are limited for full Gamepad API work. If you test there, record that fact with the result. The browser is part of the measurement.
Connect by USB first, into a direct port, not a hub. Use a data cable, not a charge-only cable. Charge the controller first. A hub, weak cable, or low battery can each add variable time. The control run must be as clean as possible. Close overlays, remappers, and background load for the clean run. That includes Steam Input remapping, DS4Windows, and screen-recording overlays.
Use the same motion for every run. That is the most important rule in this post. If you rotate a stick slowly on the wired run and flick a button fast on the wireless run, you have changed two variables at once. Then the comparison tells you nothing. Pick one motion (continuous stick movement, or steady repeated button presses) and repeat it exactly. Note browser, operating system, connection, and motion with each result.
One short reading aid, and only one. Polling interval is the report interval between reports, calculated as 1000 ÷ Hz. So 125Hz means a report interval of up to 8ms. 1000Hz means a report interval of up to 1ms. That is maths, not a measurement of your controller. It explains part, only part, of any interval you see. For the full polling explanation, see polling interval is one slice of the chain.
How to measure controller input lag online: the 10-second method
Follow these seven steps in order. They are the HowTo for this post, and the visible step text below must match the HowTo schema word-for-word at publishing.
How to Measure Controller Input Lag Online
Total Time: 10 minutes
Step 1: Connect wired first for the ceiling/control run.
Action: plug in by USB, direct port, data cable, charged. You should see: the controller detected before you move anything. If it fails: press any button to wake the Gamepad API, refresh, try another port or cable, use Chrome or Edge with remappers closed.
Step 2: Open the test and wake the Gamepad API.
Action: open the input lag test, press any button once. You should see: the test recognises the controller and begins reporting input. If it fails: no reporting usually means the browser has not yet seen the controller, not that it is broken. Wake it, refresh, and recheck first.
Step 3: Move continuously for a full 10 seconds, do not leave the input still, do not do one flick.
Action: move a stick continuously, or press and release a button repeatedly at a steady pace, for a full 10 seconds. You should see: a stream of intervals across the whole sample. If it fails: a still input or a single flick gives almost no data. Discard the run and repeat the full 10 seconds.
Step 4: Read min, average, p95 and max together and record them with browser, connection and motion.
Action: write down all four numbers, plus browser, operating system, connection, and motion. You should see: four comparable numbers, not a single average. If it fails: an average-only record is incomplete. Rerun it and record the full set: p95 and max are where spikes live.
Step 5: Repeat the identical run wireless (Bluetooth, then dongle if you have one) and record the same four numbers.
Action: disconnect USB, connect by Bluetooth, repeat the exact motion for 10 seconds, record the same four numbers. With a 2.4GHz dongle (for example an Xbox Wireless Adapter) repeat again on the dongle. You should see: a second (and possibly third) comparable set. If it fails: if motion, browser, or display changed, the comparison is invalid. Keep everything identical except the connection, and rerun.
Step 6: Repeat the wired run once more: if the second wired run differs wildly from the first, the sample was not clean; retest before concluding anything.
Action: plug back in by USB and repeat the identical 10-second motion. You should see: a wired result close to the first wired result. If it fails: a wild difference means something changed, background load, a remapper, a hub, interference, or an unsteady sample. Find that variable first.
Step 7: Compare pairs: wired vs wireless, same motion, same browser: that gap is the connection’s contribution.
Action: place the wired four numbers beside the wireless four numbers, number by number. You should see: the gap in average, and separately the gap in p95 and max. If only the average moved, the connection is consistently a little slower. If p95 and max jumped while the average barely moved, the connection is spiky: different problems, covered in the spikes section below.
That is the whole method: 10 seconds of continuous input, four numbers, a wired control run, a wireless comparison run, and a wired repeat. Everything after this section is reading those numbers correctly, not adding new steps.
Why a result near 16–17ms does not automatically mean a slow controller
A result near 16-17ms does not automatically mean a slow controller. This is the most common misreading in browser lag testing, and it has a simple mathematical cause. At 60 frames per second, one frame lasts 16.7ms (1000 ÷ 60, maths). A browser test reports intervals through the browser’s frame loop. That loop uses requestAnimationFrame, the mechanism browsers use to time animation to the display. It can therefore show intervals clustering near 16.7ms even when the controller is not slow. The cluster reflects frame timing, not controller delay.
The same maths explains why the cluster moves on a faster display. 120Hz = 8.3ms. 144Hz = 6.9ms. 240Hz = 4.2ms. Those are 1000 ÷ refresh rate, maths only. None of those figures is a lag measurement. They are frame intervals. They explain why a result near 16ms on a 60Hz display and near 8ms on a 120Hz display can describe the same controller.
Judge by the wired-vs-wireless gap and by p95 and max, not by a single average near a frame boundary. If wired and wireless both cluster near the same frame interval on the same display, the frame gate dominates that number. It is not the controller. Wireless p95 and max can pull away on the same display with the same motion. That gap is the connection’s contribution. Never quote a browser interval as the whole story: the game and display add their own time on top, and this test cannot see either.
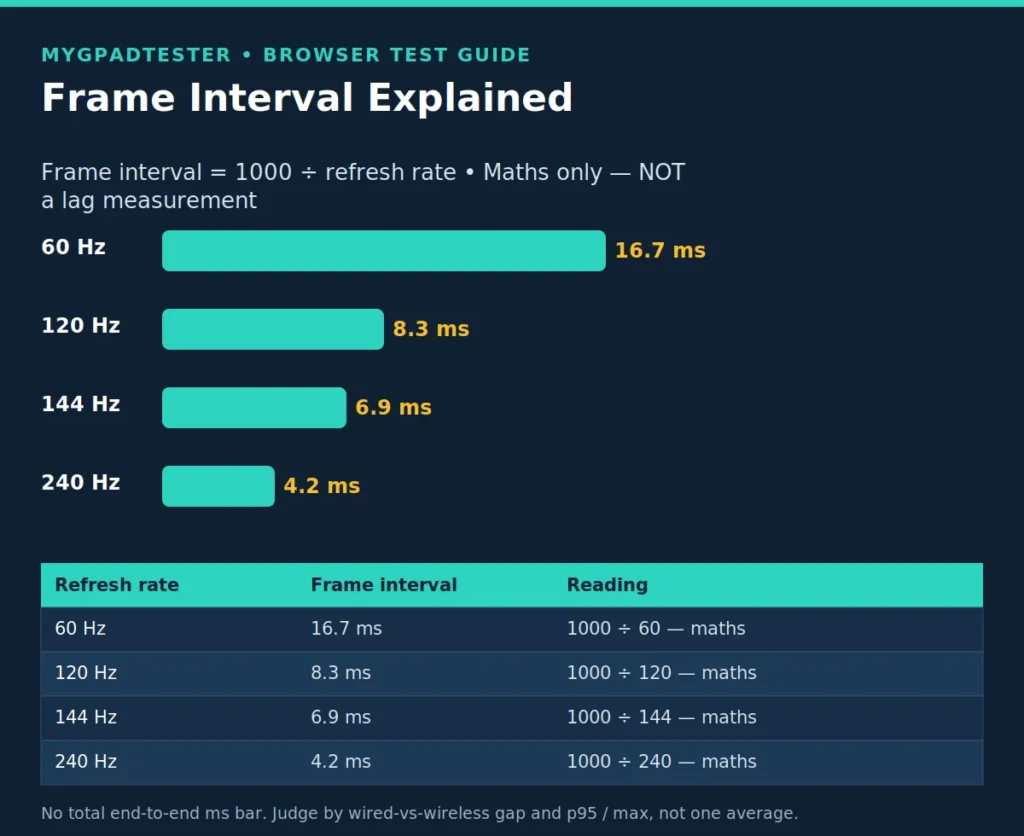
| Refresh rate | Frame interval |
| 60Hz | 16.7 ms |
| 120Hz | 8.3 ms |
| 144Hz | 6.9 ms |
| 240Hz | 4.2 ms |
Spikes vs a high average: two different problems
A steady high average and a low average with high spikes look similar if you only read the average. They are different problems, with different causes, and they need different next steps. This is why the method insists on four numbers.
A steady high average (min, average, p95 and max all elevated together) means a consistently slow link. Suspects, in order, are the polling interval, the connection itself, and a software layer. The polling interval is the report interval between reports. The software layer sits between controller and browser. Check polling first, then connection, then close remappers and overlays one at a time.
A DualSense, DualShock 4, Xbox Series, Xbox Elite Series 2, Switch Pro, Joy-Con, 8BitDo, GameSir, or Steam Deck controller can all show this pattern. It points at the link, not at a brand. No brand-specific number is claimed here.
A low average with high p95 and max means spikes and dropouts, not steady slowness. Typical gaps are fine, but almost-worst and worst gaps are far above average. Suspects are interference, a hub, low battery, background load, or a remapper or overlay that occasionally stalls the input path. Examples are Wi-Fi interference, a crowded 2.4GHz environment, a controller at the edge of Bluetooth range, or a background download or recording task. Change one variable at a time (cable, port, hub, battery, distance, browser, remapper off) and retest after each change.
Never declare a controller “broken” from one spiky sample. One sample is a suggestion to retest, not a verdict. Wireless is not automatically bad and wired is not automatically perfect. A dedicated 2.4GHz dongle is usually steadier than generic Bluetooth. But that is a tendency, not a fixed millisecond saving. Test your own pair; no fixed wireless penalty is claimed here.
What a browser test cannot prove: read this before you quote a number
A browser test measures what the browser can see: Gamepad API timestamps and reported axis and button values. The W3C Gamepad API specification (https://www.w3.org/TR/gamepad/) is the authority for how the browser reads input. Timestamps are set when axes and buttons are updated. Axes are normalised to −1.0 to 1.0.
What the browser cannot see is everything else. It cannot see your thumb move or the pixel change, so it cannot measure press-to-timestamp or display time. It cannot measure game-engine time or render-queue time. It cannot measure time spent waiting for:
- VSync
- a frame cap
- exclusive fullscreen versus borderless window
- Game Mode
- G-Sync/FreeSync
- NVIDIA Reflex
- AMD Anti-Lag.
Those sit outside this test.
True end-to-end lag (press to photon) needs hardware: a high-speed camera, a photodiode, or an oscilloscope. Reaction-style cue tests measure reaction plus the whole system, not the controller alone, and must not be quoted as controller lag.
Browser-estimate bands, labelled browser-estimate only and carried from the Day 2 foundation, are: under 8ms excellent. 8–16ms is normal. Above 16ms, investigate the controller link.
These are NOT end-to-end totals. No single lab end-to-end table is copied here as a house fact. End-to-end totals depend on game, display, refresh rate, and method. They are not directly comparable across sources. The Day 2 foundation post What Is Controller Input Lag? covers the full chain. This post does not repeat that chain or its fork table. Where the chain is needed, it is one sentence. The browser interval is the controller’s contribution. The game and display add their own time on top.
Limitations Box: what this test cannot tell you
- Browser-observed intervals only. A comparison tool, not a certification of hardware speed.
- Frame-rate gated. Browser intervals cluster near frame intervals (60Hz = 16.7ms, 120Hz = 8.3ms, 144Hz = 6.9ms, 240Hz = 4.2ms, all maths). A cluster near a frame boundary is frame timing until the wired-vs-wireless gap proves otherwise.
- Game and display time not included. A clean controller result does not mean a fast game, and a slow-feeling game does not mean a slow controller.
- Repeat and change one variable before any conclusion. One sample is never a verdict.
- Firmware, drivers, and software layers matter. A firmware update, driver change, Steam Input remapping, or DS4Windows can change a browser interval without the hardware changing. Record the software state with each result, and retest after any update.
- No guaranteed saving is promised by any first check in this post. VSync, frame cap, Game Mode, a dongle, or a cable change are first checks for a symptom, then retest, never a guaranteed millisecond saving.
Five terms get mixed up in lag talk, so here is the short version. Polling rate is how often the controller reports, measured in Hz. Report interval is the time between those reports, and it is 1000 divided by Hz. This post measures one slice of input latency, the controller-to-browser slice: the time from your press to the browser seeing it. Jitter is how much that timing wobbles between samples. Browser measurement is what this post does: it reads Gamepad API timestamps, so it only ever describes the controller-to-browser slice, never the whole chain.
Troubleshooting: problem, cause, fix
Find your problem in the table, change one variable at a time, and retest the identical run before you conclude anything.
| Problem | Likely cause | Fix |
|---|---|---|
| Sample shows one huge max only | One-off spike or stall in that run | Retest the identical run; ignore a one-off spike unless it repeats |
| Every run spiky on Bluetooth, clean wired | Connection, interference, or battery, not wear | Change one variable at a time (cable, port, distance, battery, Bluetooth vs dongle); retest after each |
| Spiky only with a remapper or overlay on | Software layer (Steam Input, DS4Windows, overlay) | Close it and retest; if spikes vanish, that layer was the cost |
| Controller not detected | Gamepad API not yet woken, wrong port or cable, remapper holding the device | Press any button, refresh, try another port or data cable, use Chrome/Edge, close remappers |
| Numbers differ on two monitors | Frame-rate gate: different refresh rates, different frame intervals | Compare only on the same display, same refresh rate, same browser |
| Input moves without touch | Drift, not lag, a rest-position fault, not a timing fault | Test drift separately with the Stick Drift Test tool; do not try to fix drift by chasing lag numbers |
| Average looks fine but game still stutters | Spikes hidden by the average, or game/display time outside this test | Read p95 and max; if the controller pair is clean, remaining time is game or display |
| Wired and wireless look identical | Connection is not the slow link here | Check the polling slice and software layers; retest on the same display |
Related Tools
Pillar highlighted: This post supports: Input Lag Test.
- Input Lag Test: https://mygpadtester.com/input-lag-test/, This post supports: Input Lag Test
- Polling Rate Test: https://mygpadtester.com/polling-rate-test/
- Stick Drift Test: https://mygpadtester.com/stick-drift-test/
- Stick Deadzone Test: https://mygpadtester.com/stick-deadzone-test/
- Button Test: https://mygpadtester.com/button-test/
- Vibration Test: https://mygpadtester.com/vibration-test/
- Trigger Test: https://mygpadtester.com/trigger-test/
- Gamepad Health Checker: https://mygpadtester.com/gamepad-health-checker/
Homepage, in this grid only: https://mygpadtester.com/
Related Guides
- Pillar first: Input Lag Test: the tool this guide supports.
- Same silo: Stick Drift Test: if input moves without touch, that is drift, not lag; test it separately.
- Related silo, exactly 1: What Is Controller Polling Rate?: polling interval is one slice of the chain, for the one short Hz→ms reading aid only.
- Next in this series: Bluetooth controller lag fix and How to reduce controller input lag on PC. The wired-vs-wireless lag comparison, Steam lag fix, and cloud lag separation posts are not published yet, so they stay text only with no link.
- Same silo: What Is Controller Input Lag?: the Day 2 foundation post on what input lag is; the full lag chain lives there.
About the Author
Marcus Sterling, Lead Engineer & Founder, MyGpadTester, Austin, Texas, USA
Marcus Sterling is a Certified Hardware Analyst with over 12 years of hands-on experience in gaming peripheral diagnostics. He is professionally certified by iFixit as a Master Tech, and has spent years analyzing Hall Effect sensors to solve the industry’s stick drift crisis. He built MyGpadTester to give every gamer the same pro-level diagnostic tools he uses on his own workbench.
Affiliations: Associate Member of IEEE (Consumer Electronics Society) · Specialization: Advanced TMR Magnetic Sensor Calibration & Latency Testing · Former: Lead Tech at Performance Labs TX in Austin · Certifications: ESD Professional & Master Hardware Diagnostic Certified
Tests follow the MyGpadTester methodology: same browser, same connection, wired first, retest before deciding. Results are browser estimates via the W3C Gamepad API, not lab measurements.
Author Profile Page · About · How We Test · Contact · X (Twitter)
No photo. No other social link. No stock or AI photo.
Frequently Asked Questions
How do I measure controller input lag online?
Open the input lag test and connect wired first. Move a stick or press a button continuously for 10 seconds. Read min, average, 95th percentile and max together. Then repeat wireless with the same motion.
What is a good browser input lag number?
Browser-estimate guide only, not end-to-end: under 8ms excellent, 8–16ms normal, above 16ms investigate the controller link. Judge stability (p95/max) as well as average.
Why does my test show around 16ms?
At 60fps one frame is 16.7ms, so browser intervals can cluster near frame timing. Compare wired vs wireless on the same display, and look at p95/max, not one average near 16ms.
Is average or maximum more important?
Both, plus p95. Average is the comparison number; p95 and max show spikes. A low average with a high p95 feels worse than a slightly higher but stable average.
Can a browser test measure true end-to-end lag?
No. It measures the controller’s browser-observed contribution. True end-to-end needs the game and display too, measured with hardware, not a browser timestamp alone.
Why is wireless lag higher than wired?
Wireless scheduling, interference, low battery and dongle/Bluetooth differences add variable time. A dedicated 2.4GHz dongle is usually steadier than generic Bluetooth. But test your own pair. Do not assume a fixed ms saving.
Should I retest if one sample looks bad?
Yes, always. Repeat the identical run, change one variable at a time, and compare pairs. Never decide from a single sample.
Why do my numbers differ on two monitors?
Different refresh rates give different frame intervals, so browser intervals cluster near a different frame boundary on each display. Compare only on the same display, at the same refresh rate, in the same browser, with the same motion.
Next Steps: end only, no affiliate links
- If the controller link is spiky: change cable, port, or connection and retest, one variable at a time. Follow the Bluetooth lag fix guide if the fault is the wireless link.
- If the controller link is clean but games still feel slow: the remaining time is game or display. Follow the guide on reducing input lag on PC for the Game Mode, refresh rate, VSync, and frame cap checks: this post diagnoses, it does not become the fix guide.
- If input moves without touch: use the Stick Drift Test: that is drift, not lag, and it needs its own test.
- If you want a screening pass across all inputs after this test: use the Gamepad Health Checker.
- Steam Input A/B checks and cloud lag separation are named here in text only, no link, until their posts are
- published. They are not part of this measurement method.